| Speed | Accessibility | Reading age |
|---|---|---|
|
0.94
Average: 0.91 Out of 1.0 |
1
Average: 0.97 Out of 1.0 |
14
to 15 years |
Good scores (0.9 and above) here mean that you're getting some basics right - your site is fast and covers accessibility basics. That's a great foundation to put the focus where it belongs: on understanding and meeting user needs.
What it feels like to watch it load
This video shows the experience of loading the site on a (globally) average device and internet connection, compared with our highest performing site.
How it's changed over time
Great responses change and evolve as the situation changes and as our understanding of user needs change.
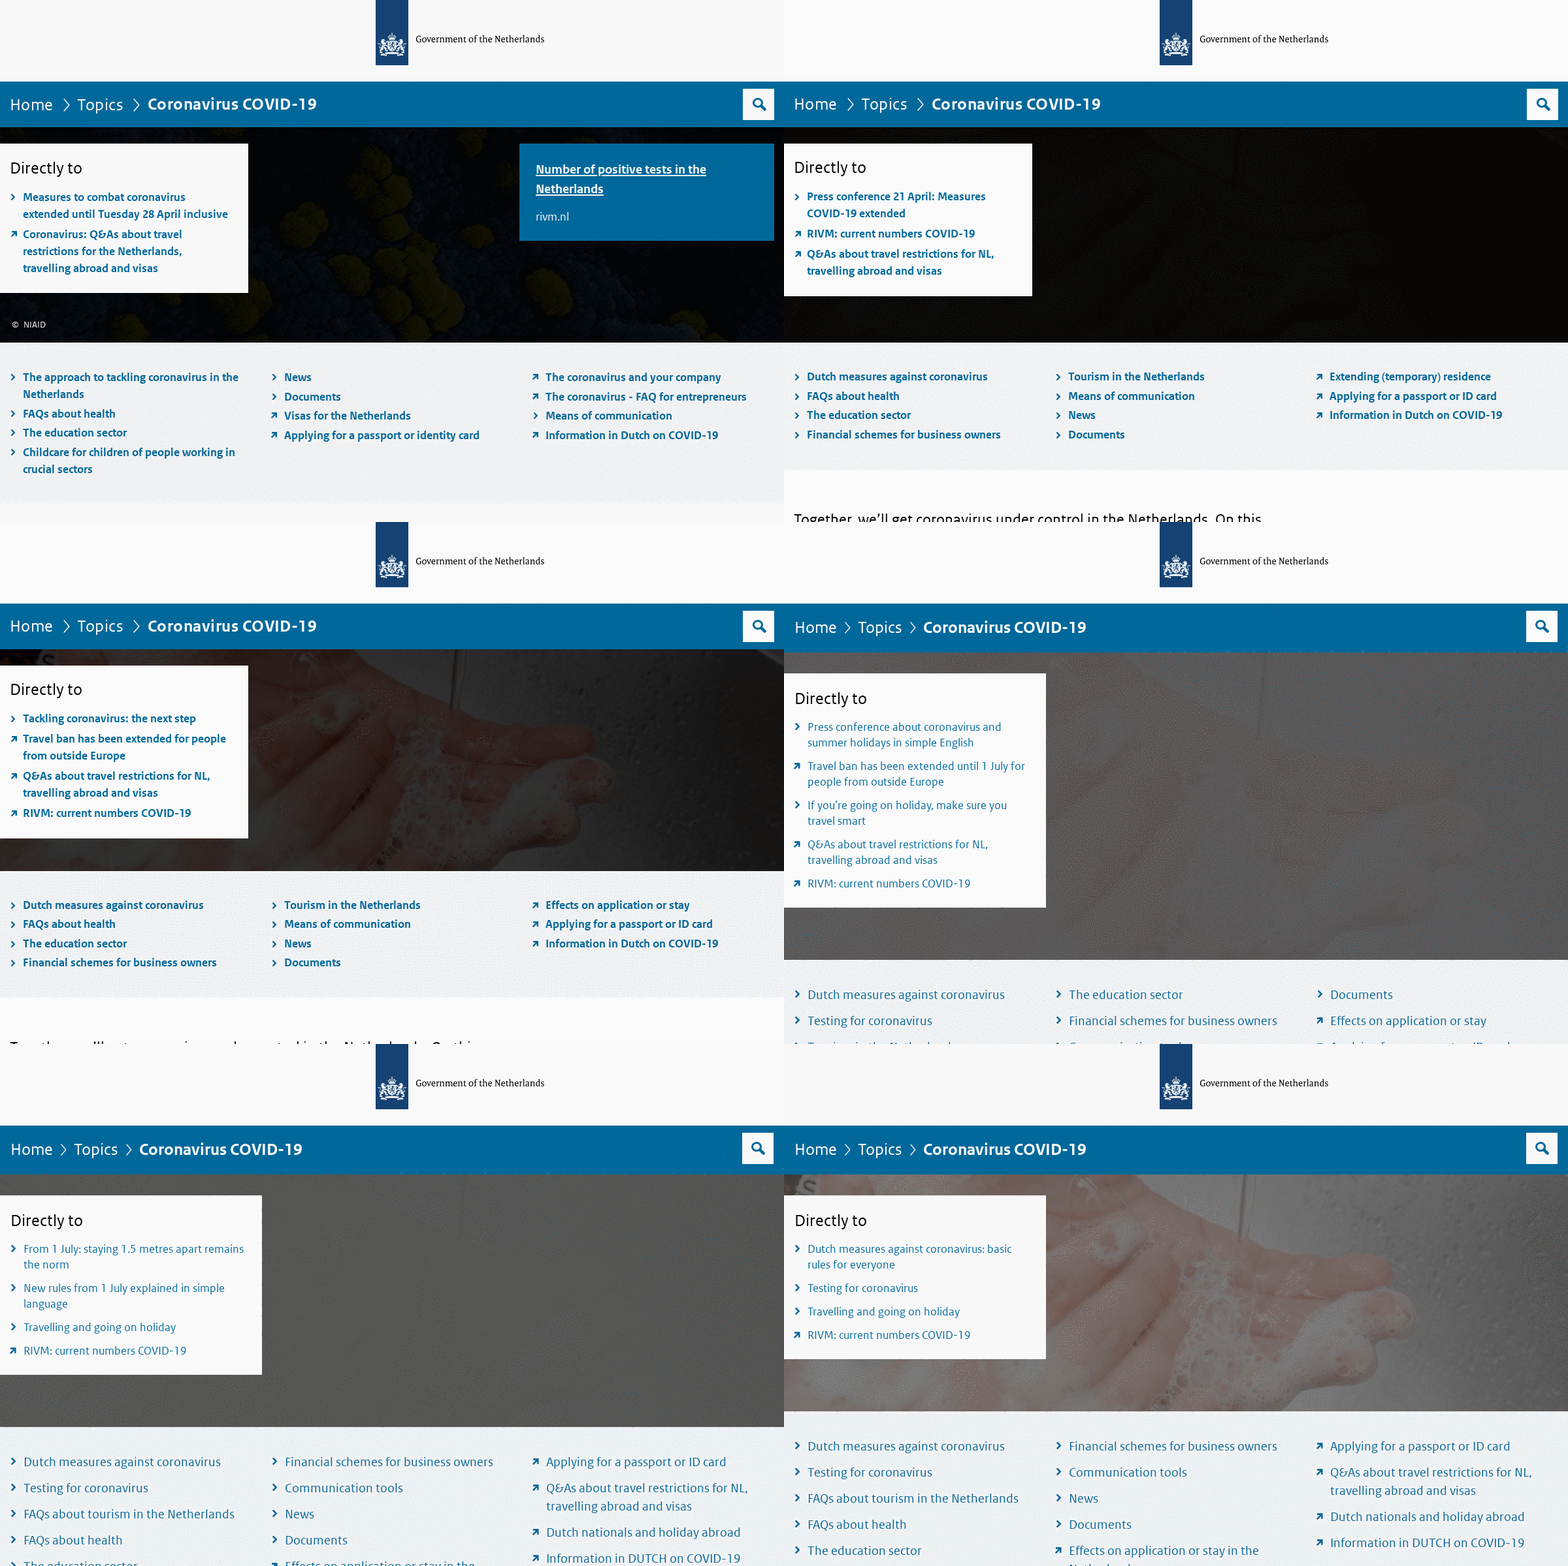
What shouldn't change is their speed, accessibility and clarity. We've captured a timelapse of this site over time and built graphs of their scores over time.

Speed
Accessibility
Note: A score of 0 usually shows a gap in our data, not a regression in the site's behaviour.
Things we're considering adding:
- Who owns this site? Perhaps grouping sites from the same government/geography
- How much does it cost to load the site based on local data costs?
- Where this site appears in the league tables
- Bringing back readability calculations
If you want to understand the methodology, you can find the raw data and code on github. If you want to provide feedback (and we'd really appreciate that), please email James Stewart.